A tool to assess the relatedness between any two given VRE isolates
1. ClonalTracker first runs Blastn to assess the van type.
Based on the Blastn output both genomes are vanB type.
If both isolates are the same van type, ClonalTracker assesses the transposon similarity.
2. For the transposon typing step, ClonalTracker first runs Blastn to identify the contig(s) that belong to the transposon. In this case using the AY655721.2 transposon sequence as reference:
A7 and A12 vanB transposon is found in a single contig in both cases. Thus, RagTag step to scaffold the transposon will be skipped in this case.
2.1. To assess insertions, ClonalTracker runs ISEScan and Clinker to visually compare both transposons at the proteome level, which are annotated using Bakta
*Click the option "Show only best links" and "Show gene labels" changing the label type to "gene" for instance from the clinker menu to more easily interpret the results.
These two transposons are identical at the protein sequence level.
2.2. To assess transposon's gene composition and synteny, both transposon's sequences are compared using Blastn.
These two transposons are also identical at the nucleotide sequence level.
3. Finally, both whole genomes are compared using Mash, a k-mer based approach:
Genomes A7 and A12 share 97.7 of the k-mers (7818/8000) and the estimated Mash distance is 0.000361643 with a p-value of 0. The threshold we use to determine if two isolates are clonally related or not are having the same transposon (identical ISs, gene content and arrengement) and at least share 95% of the k-mers. In this case, as the transposon of both isolates is identical, these two isolates are clonally related.
Besides the outputs and tables shown in this page, ClonalTracker provides all the intermediate files that have been created for further inspection, check it out in results.zip
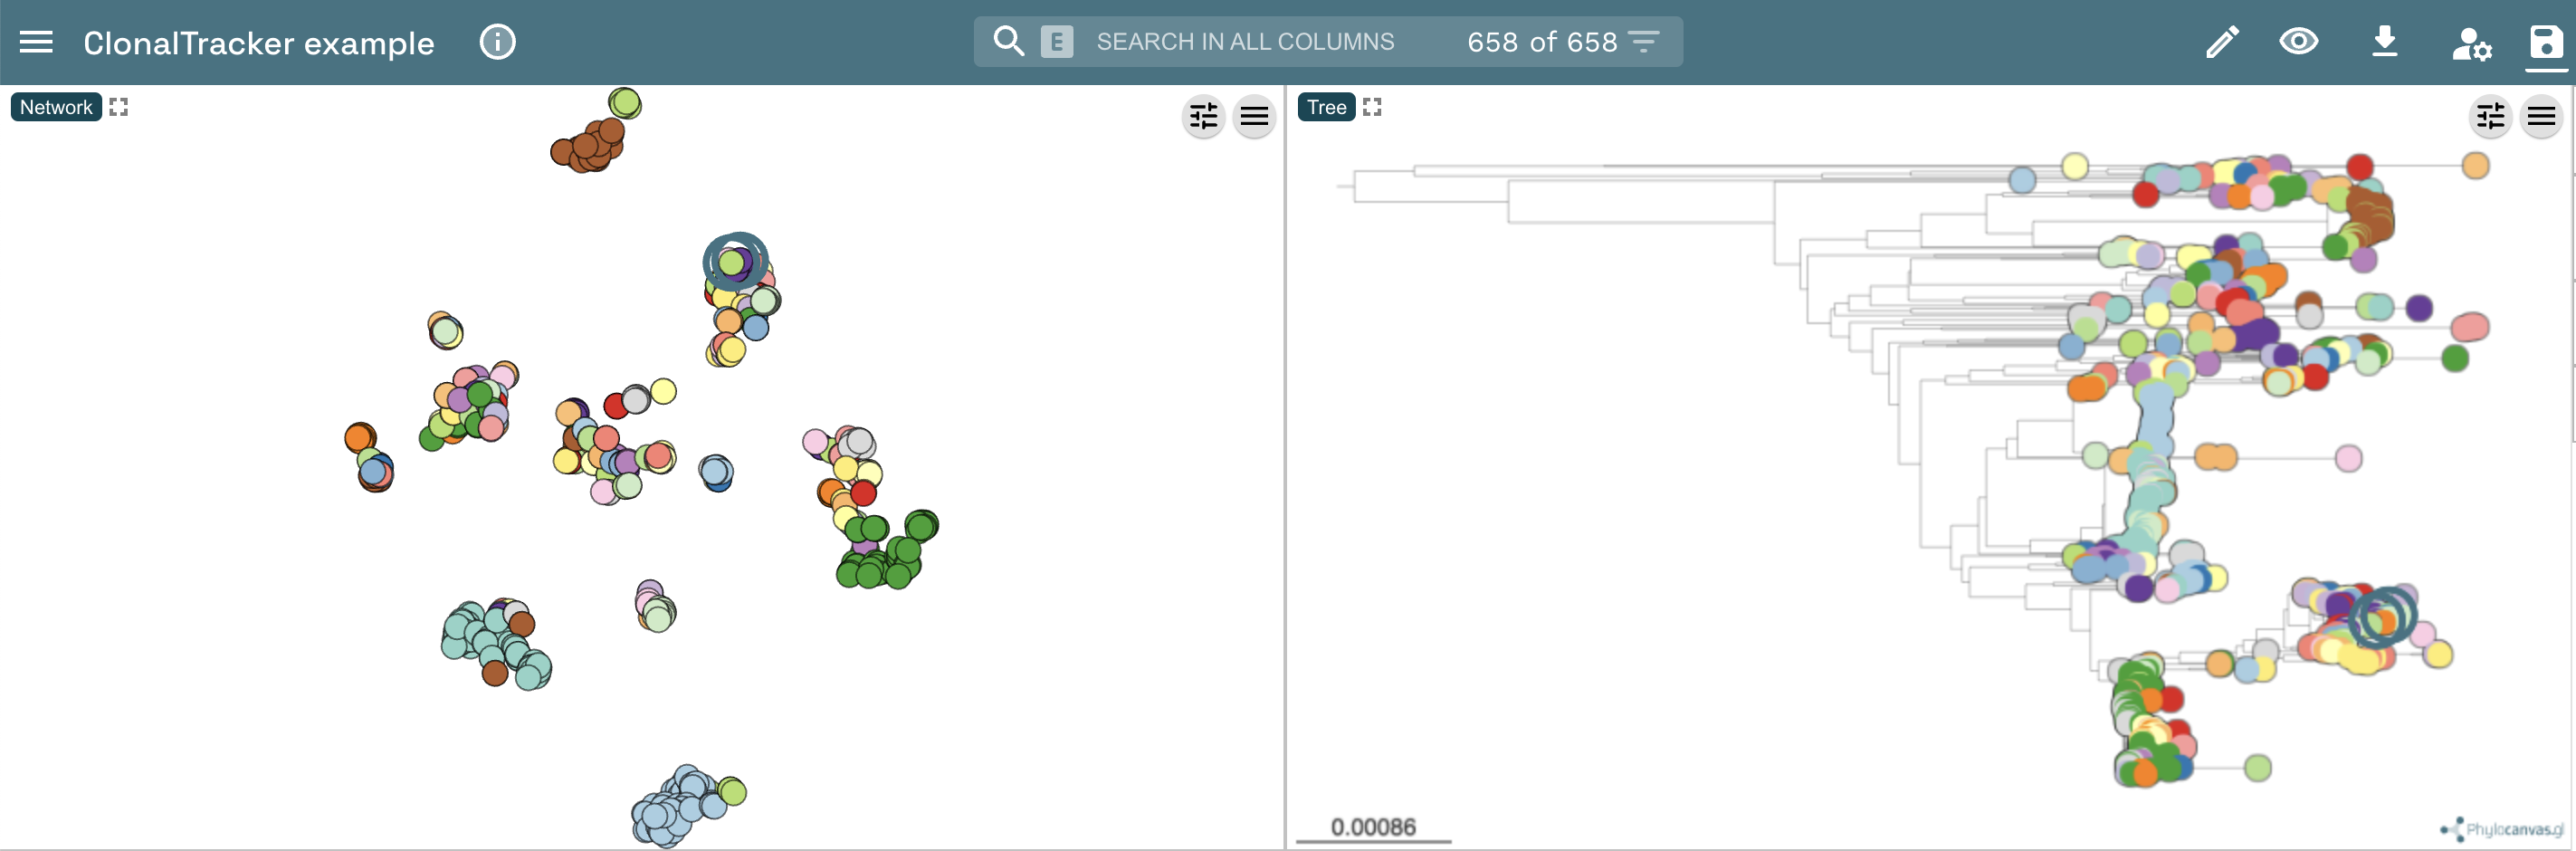
Please, remember that within the output directory ('vanAB_dataset_updated/microreact_viz/'), you can find the three files that can be uploaded in Microreact to visualize PopPUNK results. The two isolates have been compared and clustered together with 656 vanA and vanB VRE isolates isolated in the Netherlands between 1999 and 2015. For more information on this dataset please check the Arredondo-Alonso et al publication.
As an example, we have uploaded these three files in Microreact. In the image below, you can see a network displaying the clusters into a 2D space (on the left) and a hierchical clustering based on the PopPUNK core genomic distances (on the right). In both panels you can see A7 and A12 highlighted. You can also check and play with these visualization by clicking on the following link.